
Japan is Facing a Problem of Seriously Aging Population. See the Transitions From 1920 To 2065 with Time-machine-like Interface.
Japanese Population Pyramid
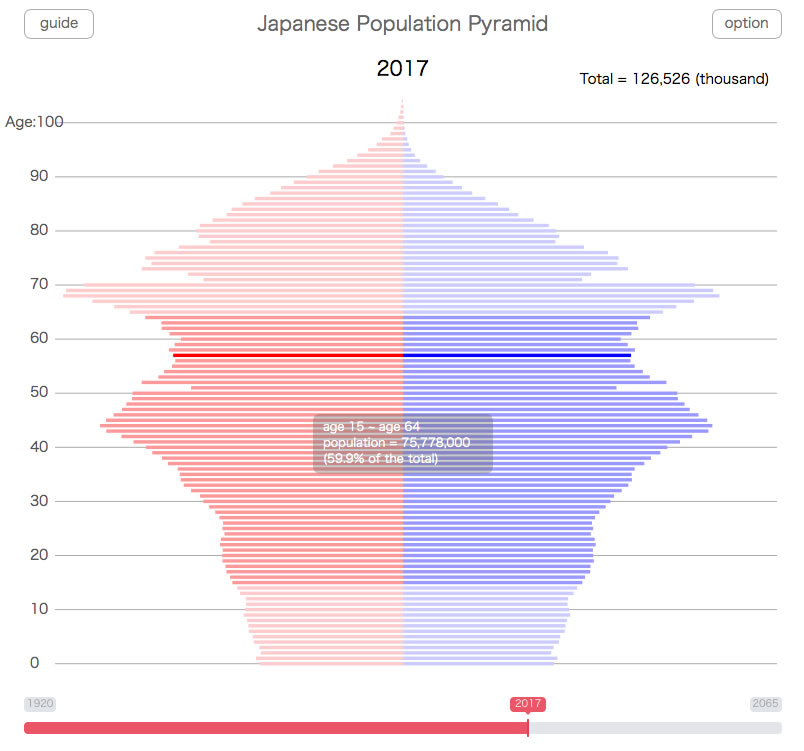

Move the slider bar on this visualization to see the changing shape of the Japanese population pyramid.
As you know, the age structure of a nation has profound influence to the soundness of its society and economy.
After the last war, Japan has experienced a rapid economic growth realized by the fluent overseas investiment, technological develpment and diligent workforce. Until the working age (25~65) ratio hit the peak of 70% in 1992, Japan has appearently enjoyed the merit of so-called "population bonus".
Japanese baby boomers who were born around 1948 have led outstanding new trends as for culture and society. But now, after they passed the age of 65 in 2015, their overwhelming volume boosts the aging of the society.
Actually old age polulation (equal and over 65) ratio has doubled from 1 among 10 in 1985 to 1 among 5 in 2005, and has reached 1 among 4 in 2013. It will be 1 among 3 in 2036. Moving the slider bar, you'll see the pyramid loses its shape unsoundly.
- As for the period of the last war (1941~1943), no data is available.
- Male polulation is significantly low just after the war, until the demobilization is proceeded.
- *As for ages 85 or over until 1979, ages 90 or over until 2004 and ages 105 or over after 2004, numbers by age are not available. Accordingly the top of the pyramid is displayed flat.
User's Guide
- Visualized is the Japanese population structure from 1920 to 2065.
- Use the slider bar below to change the year and see transitions.
- On PCs, numbers of population will be indicated along the pointing with the mouse.
- On smart devices, numbers of population will be indicated along the pointing with the finger
From the right above "option" button, the following functions can be set up.
- Show explanations (available for some years).
- Select a paticular year of birth to show the position of it on the population pyramid.
- Select a targeting period of age to show the extent and ratio of it on the population pyramid.
Sources
Data sources for this visualization are as follows.
- Data from “e-Stat”(www.e-stat.go.jp)
“Population by Age (Single Year) and Sex (as of October 1 of Each Year) ‐ Total population (from 1920 to 2000)”
“Population by Age (Single Year) and Sex (as of October 1 of Each Year) ‐ Total population (from 2000 to 2015)” - Data from National Institute of Population and Social Security Research(http://www.ipss.go.jp)
- *As for the all the ages on 2016 or after and the age 100 or over on 2010 or after, estimation data by the National Institute of Population and Social Security Research are used.
Feedback
Your messages and opinions are welcome for our better future production.
*Your message may be shown on our web site.
*If you want to contact us, please use this web form.